In the wake of recent downward trend in China’s economy, there have been a spate of articles and analyses predicting its early doom. However, It does seem unreasonable to postulate that an economy with over 71 per cent labour force participation, an economy that is still the largest exporter in the world--a title it has held since 2009--is regressing, especially after only just two years of relatively poor growth.
And yet, in spite of the large size of the Chinese electronics market, its undisputed position as a leader in the manufacturing sector and its huge service sector ambitions, there is indeed a cause for concern in Beijing. So what is the reality?
First of all, let us examine the claims that the method of controlling capital outflows and fixing an exchange rate leads to an accretion of exports. Does weakening of currency really lead to an increase in exports? In theory, since China is willfully lowering the prices by cheapening the Yuan, in the short run, the demand should increase given that the products are cheap (or as economists would say: keeping demand constant, a decrease in price would shift the supply curve outwards leading to an increase in quantity) and yet there is no empirical evidence to suggest that there has been any positive short run changes due to this theory. While the ‘general equilibrium’ economic model has been a useful tool to predict simple economic changes, its static nature leaves a lot to be desired, especially in this case; as of December, China’s exports have fallen more than 2 per cent in the past year, its first annual decrease in four years1. Exports for February 2016 dropped almost 25.4 per cent, down to $126.1 billion compared to February last year, whereas imports fell by 13.8 per cent2. China has mended the gap somewhat, as of May 2016, with overseas shipments falling 4.1 per cent in dollar terms from June 20153 yet the rate was twice that of April when exports dropped only by 1.8 per cent4 year-on-year. If the primary purpose of devaluation of currency was to boost volume of exports, the Chinese plan has been way off the mark. There is more evidence to suggest the inherent futility of currency devaluation much closer to home. India’s currency has been declining at a rate faster than that of China’s. As of the 26th of February 2016, the Rupee hit an all time low of 68.79 to the Dollar5. Compared to a year ago, when it was 61.9875 to the Dollar, the Rupee has depreciated about 11 per cent (for the same time period, Chinese depreciation is a little over 4 per cent, from about 6.25 Yuan to 6.52 Yuan per Dollar6). Given that export data has been poor for both countries, it can be claimed with reasonable certainty that devaluation has not led to a boost in exports as previously imagined.
In addition to this, there is perhaps another reason why China would consider devaluing its currency. The reason could be to gain inclusion of the Yuan in the basket of Special Drawing Rights from the IMF. The successful inclusion of Yuan in the SDR basket is a clear acknowledgement of China’s heft in the world economy. The RMB Yuan now takes its place alongside the US Dollar, the Euro, the Japanese Yen, and the British Pound in the SDR basket.
It is also only a matter of time, now that the US Congress has ratified the quota changes agreed under the G20 amendments in IMF/World Bank quotas, for the voting rights of China (together with other developing countries like India) to be enhanced. Simply put: countries are allocated SDRs in proportion to their IMF quotas, which are assigned on the basis of the GDP, openness, economic variability and international reserves of a country. IMF quota is used to determine a country’s subscription (which refers to the amount of financial resources a member is obliged to provide the IMF), its voting power in IMF decisions and the amount of financing a member country can obtain from the IMF. These SDRs can be used to make payments for subsequent quota increases, to settle debts owed to the IMF or to rebalance reserves. Before its inclusion, the US Dollar, Euro, Pound and Yen were the four currencies that were considered ‘freely usable currencies’. Prior to its inception, the PBoC (People’s Bank of China, the Chinese Central Bank) was informed by the IMF that they needed to diversify their currency, as in, that more countries are required to make payments in Yuan to establish it as an international currency. Cheapening the Yuan could have helped in making it more ‘freely usable’. As mentioned above, the depreciation in the currency did not lead to a boost in exports but the IMF noted in its 2015 SDR review that “since the last SDR review in 2010, the use of the Chinese renminbi (RMB) in international payments has risen substantially7” which may have been bolstered by the devaluation. However, such deductions are purely hypothetical and the relationship between the devaluation and acceptance into the currency basket remains tenuous at best.
In order to take the analysis further, it is necessary to examine recent trends in Chinese exports. Leaving aside the steel industry for a moment, where a glut in steel around the world has led to a decrease in production (China is the world’s largest producer and consumer of steel) it will be interesting to focus momentarily on electronic goods to draw out a simple point. In spite of the general downturn in Chinese exports, the electronics sector has grown during the past year. However, China’s economic data seems to be very scattered: for example while the growing electronics sector seems to point towards the step China is taking towards the ‘consumption based’ economy which is being talked about, there are two major economic indicators that seem to suggest otherwise. For one, China’s rail freight capacity as of October 2015 has fallen 16.3 per cent year on year8. According to the NDRC (National Development and Reform Commission) of China, in the first 10 months of 2015, rail freight slipped 11.9 percent from a year earlier to 2.8 billion tons, a sharper decline than the 11.4 per cent decrease for the first nine months (and as per Reuters, the total fall was 10.5 per cent in 2015). Even as of 2014-2015, volume had fallen by 4.7 per cent9. By comparison, the Indian Railways saw an increase of 4.15 per cent in 2015 from the previous year (up almost 44 million tons from 1,051 million tons in 2014) and revenue generated from freight operations increased by 12.59 per cent to Rs. 1,03,100 crore in the same time span.
In terms of electricity consumption, which is considered a good indicator of economic activity, China’s growth has been suspiciously slow. Their electricity demand grew by only 0.5 per cent in 2015, while coal consumption dropped by 5 per cent and coal imports dropped 35 per cent10. As per Buckley, one of the Directors at Institute for Energy Economics and Financial Analysis (IEEFA): “The decoupling of economic growth and electricity demand is a key driver of the Chinese energy transformation and is being witnessed first hand”. While the sentiment conveyed in the quote is laudable, it doesn’t quite make sense from an economics point of view. The article states that the Chinese government has curbed the use of coal and gas and is moving towards alternate sources of energy such as nuclear, solar, wind etc. but this doesn’t change the fact that China’s electricity demand growth is potentially dubious for a country with that kind of GDP growth. Indeed, research work carried out by many major research organizations have come to the same conclusion. The US Energy Information Association, in particular, has done quite some research about the strong correlation between electricity demand growth and the economic growth in the US, calling electricity use and GDP good indicators of each other11. Ironically, while middle income countries were seen as somewhat capricious with such correlations, with their unreliable economic data, it was China that was seen as being authentic in this regard12. A Wall Street Journal article points to the previous years’ electricity demand growth, which closely mirrored China’s economic growth, for example in 2013 when the growth rate was 7.7 per cent to electricity growth of 7.6 per cent. Outliers aside, the strong correlation between the economy and electricity is nigh indisputable and the sharp downward trend from 2013 onwards doesn’t bode too well for China. Especially given the fact that India, just like its economy, has made huge strides in power generation, growing by around 8.43 per cent in 2014-15 and 6.04 per cent in 2013-1413.
Before proceeding further, a few words about the quality of the two economic indicators used. These were also two-thirds of the famous ‘Keqiang index’ propounded by the Chinese Premier (in 2007 as local Party Secretary who retracted it as quickly as he proposed it); electricity consumption, rail cargo and rural loan disbursement were apparently better predictors of the economy for Premier Li than the GDP data. While the index has been labeled defunct (and quite rightly so given the scope of the economy and the inadequacy of the index to deal with its vastness), it can still be used singly to try and figure out China’s actual growth. Given that the index is not necessarily a perfectly accurate representation, it can still be used to try and make sense of the data provided. For one, both the rail cargo and electricity consumption have fallen. To try and rationalize this in a non economic sense, while it is true that China’s per capita electricity consumption is almost 4 times that of India (1010 kWh14 to China’s 4000 kWh), it is still nothing compared to a country like the US (around 15000 kWh). The interesting thing here though, is that the drop in demand vis-a-vis China is mirroring a country like the United States except for the fact that demand in a country like the US has already peaked. China, a country which uses about one-fourth of the amount of electricity per capita that a developed country does, should not be showing such signs of slowing down, especially given that their alleged GDP is growing at a respectable figure of 6.9 per cent and that China is supposedly moving towards a consumption-based economy, shouldn’t this new and emerging middle class drive up the demand for electricity leading to an increase in supply? It would be unwise to assume that the markets don’t play a role. China is one of the largest importers of energy in the world, and so a dampening effect based on global markets is not out of question, but the enormity of the slowdown does raise major questions as to the health of the Chinese economy.
Add to this is the big downturn being seen in the rail freight data. This can be explained in an easier manner. The decline of the manufacturing industry, alternate means of transportation that are becoming available, lack of investment in the railways sector may be among the major reasons for decline. The steel industry is a perfect example of this: as per MEPS (a leading independent supplier of steel market information) prices of steel Rebar have dropped significantly from 2740 Yuan per tonne in January 2015 to 1920 Yuan per tonne in December15. Obviously the drastic change in prices caused by the overcapacity in production, is leading to producers having to cut supply, thus leading to a decrease in rail freight. On top of this, China is facing dumping charges over the exceptionally cheap steel they have been exporting to gain market share. The US has already imposed a 266 per cent duty over these charges16 which will make it more feasible for them (the US) to rely on other exporters or their own domestic steel producers. But that is beside the point. Together, these two indicators (electricity and freight) should provide a clearer idea of the sort of problems China is facing. We have to take this information with a pinch of salt, as Premier Li backtracked and disowned the ‘Keqiang Index’ almost as soon as he’d conceived it. Of course, this is privy to one major fact that the Keqiang index may be best suited to predicting only heavy industry data and that too only for specific provinces. But the importance of the index, especially considering the general lack of transparency when dealing with Chinese data, cannot be underscored enough as long as we see the numbers in a purely objective way. Currently the Keqiang index betrays a downward trend ever since 2013 while the economy has supposedly been growing stably. The problem is that, because of the aforementioned lack of transparency, it is difficult (if not downright impossible) to try and determine whether the Keqiang index data can be suitably applied to the Chinese economy at large with fruitful results. However, one thing we can say for sure is that the Chinese economy, inspite of its stability growth-wise, is not showing a healthy outlook when it comes to some very important indicators.
The next issue to be paid particular attention is the debt crisis that the Chinese have on their hands. China has almost $28 trillion worth of debt (as of January 201617), having added nearly $20.8 trillion since 2007 which as of today stands at 282 per cent of its GDP. By comparison, India’s external debt is around $475.8 billion which is 23.8 per cent of our total GDP (as of June 201518) and Government debt is another Rs 62.78 lakh crore (about $940 billion as of March 2015, as per the Indian Economic Survey) which is about 49.6 per cent of the total GDP. In total, the government debt comprises about 39.2 per cent of public debt (internal debt plus external debt). To compare China’s debt with that of the United States; US government debt stands at about $19.3 trillion, which is approximately 104 per cent of its GDP19, significantly higher than that of India’s but substantially lower than that of China’s.
The major problem with Chinese banks is not just that of NPAs (Non Performing Assets), which, depending upon one’s point of view may or may not be as large as made out to be by the media, but also the fact that there isn’t quite any consensus on who owes whom ? the money that was supposed to have been lent out. As per a recent article on the subject, China’s NPAs have grown almost two-fold in the past financial year, from 1.05 trillion Yuan to 1.95 trillion Yuan ($296.8 billion) 20. However, this is merely the tip of the iceberg as far as this sordid saga goes. For one, we are not aware of the level of NPAs in the Chinese economy currently. While the official Chinese figures show the debt-to-GDP ratio as being a mere 41 per cent21, a plethora of sources argue otherwise. As mentioned above, the odd situation, where outrightly State owned banks are providing loans to non performing government owned enterprises is leading to a bewildering state of affairs where the government is both the creditor and the borrower. These companies, somewhat aptly dubbed ‘zombie companies’ (since they are for the most part, half dead entities, not allowed to die because of the government) are holding the government back; as per the Chinese Ministry of Finance, profits at China's state firms dipped 9.5 percent in the first 11 months of 2015 from a year earlier. Profits at SASAC (State-owned Assets Supervision and Administration Commission) controlled firms fell by 10.4 percent22 in the same time period. However, Zhang Yi, the head of SASAC has promised to help clean up the zombie corporation mess, with a form of ‘mixed ownership’ (including use of stock exchanges, property exchanges, capital markets etc. to sell assets of non performing state owned enterprises) being touted as one of the major modes of reform by the government. This shows the increasing flexibility being shown by the Chinese government in dealing with the situation at hand. But whether or not this will help clear up the problems that have been steadily creeping into the system is another thing entirely.
Next is the problem of Chinese foreign exchange reserves. China’s forex reserves have taken a severe hit over the past year, falling by $99.5 billion in January 2016 and lost approximately $762 billion since mid-2014, coming to rest at around $3.23 trillion23 (marginally up, as of June 2016, to $3.21 trillion24). While this may sound like a cause for concern, it needs to be kept in mind that even though countries such as India may be seeing an all-time high forex reserves, they are dwarfed in comparison to the amount China holds. India, for example, increased its reserves by $2.539 billion in March 2016 to end up with approximately $355.46 billion (reserves have grown to $360.19 billion as of May 27, 201625). While this is a great amount, it pales in comparison with Chinese reserves. However, as per the IMF, China needs to maintain at least a level of $1.88 trillion as an ‘FX buffer’ to ensure stability. As per the IMF methodology, a country with a fixed exchange rate and effective capital controls (such as China) needs to hold reserves equal to 10 per cent of annual exports, plus 30 per cent of short-term foreign debt, 20 per cent of other foreign liabilities and 5 per cent of M2 (that is, broad money which includes cash, savings deposits, mutual funds etc.)26.
To tie this in with the theme of dealing with China’s total outstanding foreign debt which, as of September 2015, is $1.53 trillion, Business Standard estimates that about 67 per cent of this debt is short term borrowing, that is, it has a term of one year or less27. This implies that out of the $3.23 trillion or so that China has in forex reserves, about $1.02 trillion will leave the country in one year or less. Thus, China’s effective reserves are actually $2.21 trillion which hovers uncomfortably close to the IMF’s FX buffer of $1.88 trillion. Any more capital outflows of the sort witnessed in December 2015 or January 2016 when reserves fell by close to $210 billion ($107.9 billion in December and $99.5 billion in January) and China may have a serious problem on its hands. So, even though China may currently hold a very healthy level of forex reserves, this may not be the case sometime in the near future.
In conclusion, it is necessary to reiterate the point about China’s economic fundamentals being in good shape inspite of lack of performance in the specific indicators mentioned above. Despite economic slowdown, China still managed to create 13.12 million jobs in 201528. The country has taken massive steps towards eradicating poverty, especially urban poverty. As per a UN report, China lifted 470 million people out of extreme poverty between 1990-2005, contributing to about 76.09 per cent of total poverty reduction during that period29. However, the capriciousness of eminent financial journalists, coupled with the general lack of transparency in Chinese data, leads to a situation where opinion on the subject oscillates between demonizing and lionizing the Chinese economy and the CPC. While the economy did well, there were no dearth of articles celebrating the rise of China, highlighting the US-China trade relations (more than $365 billion in China’s favour as of 201530), China’s undisputed status as an economic, military and diplomatic leader and the like. But today, in the light of worsening economic conditions the very same commentators predict a dire outcome for the Chinese economy. Given that Capital Economics (who pegged China’s GDP growth at 4.9 per cent), Citibank (4.6 per cent), Conference Board (4.0 per cent) and Lombard Street (3.8 per cent) have all pooh-poohed the official growth figure of 6.7 per cent, it stands to reason that the Chinese are painting a far too rosy picture but it is imperative to view the trickle of information with nuance rather than get swept away in the tide of emotions and argue on the basis of prevarications.
Endnotes
- http://www.bloomberg.com/news/articles/2015-12-08/china-exports-fall-for-fifth-month-import-slump-continues
- http://www.bbc.com/news/business-35751586
- http://www.bloomberg.com/news/articles/2016-06-08/china-s-exports-weaken-signaling-more-headwinds-for-growth
- http://www.cnbc.com/2016/06/07/china-may-dollar-denominated-exports-decline-in-slight-miss.html
- http://economictimes.indiatimes.com/markets/technical-charts?entity=forex&periodicity=day&createdby=Mecklai&pairnameparent=USD%20per%20cent2FINR¤cypairname=USD%20per%20cent2FINR
- http://finance.yahoo.com/chart/usdcny=X?ltr=1 {%22customRangeStart%22:1424930400,%22customRangeEnd%22:1459314000,%22range%22:%22custom%22,%22allowChartStacking%22:true}
- http://www.imf.org/external/np/exr/faq/sdrfaq.htm#two
- http://english.gov.cn/archive/statistics/2015/11/18/content_281475237404978.htm
- http://www.reuters.com/article/china-transportation-railway-freight-idUSL8N14P05I20160105
- http://ieefa.org/chinas-love-for-coal-and-coal-imports-and-longstanding-affair-with-heavy-emissions-rapidly-coming-off-the-boil/
- https://www.eia.gov/workingpapers/pdf/electricity_indicator.pdf
- http://blogs.wsj.com/chinarealtime/2014/01/20/what-chinas-electricity-usage-says-about-growth/
- http://powermin.nic.in/power-sector-glance-all-india
- http://www.livemint.com/Industry/jqvJpYRpSNyldcuUlZrqQM/Indias-per-capita-electricity-consumption-touches-1010-kWh.html
- http://www.meps.co.uk/ChineseSteelPrice.htm
- http://www.wsj.com/articles/u-s-imposes-266-duty-on-some-chinese-steel-imports-1456878180
- http://www.businessinsider.in/How-China-accumulated-28-trillion-in-debt-in-such-a-short-time/articleshow/50470587.cms
- https://rbi.org.in/scripts/BS_PressReleaseDisplay.aspx?prid=34314
- https://research.stlouisfed.org/fred2/series/GFDEGDQ188S
- http://www.reuters.com/article/us-china-banking-npl-idUSKCN0UQ04D20160112
- http://www.forbes.com/sites/panosmourdoukoutas/2016/01/18/the-most-scary-thing-about-chinas-debt/#2af5d14e37fc
- http://www.reuters.com/article/us-china-companies-idUSKCN0UV0GH
- http://www.reuters.com/article/us-china-forex-idUSKCN0W10PAare 25
- http://www.businessinsider.in/China-just-stunned-the-markets/articleshow/53107418.cms
- http://www.thehindu.com/business/Economy/indias-forex-reserves-dips-marginally-to-36019-bn/article8690323.ece
- http://www.bloomberg.com/professional/blog/something-in-reserve-assessing-chinas-fx-buffer/
- http://www.business-standard.com/article/pti-stories/china-s-external-debt-at-1-53-trillion-115123000975_1.html
- http://thebricspost.com/china-created-13-12-million-jobs-in-2015/#.Vw4xG_krLIV
- http://www.cn.undp.org/content/dam/china/docs/Publications/UNDP-CH_discussionpaper-MDGPost2015.pdf
- http://useconomy.about.com/od/tradepolicy/p/us-china-trade.htm
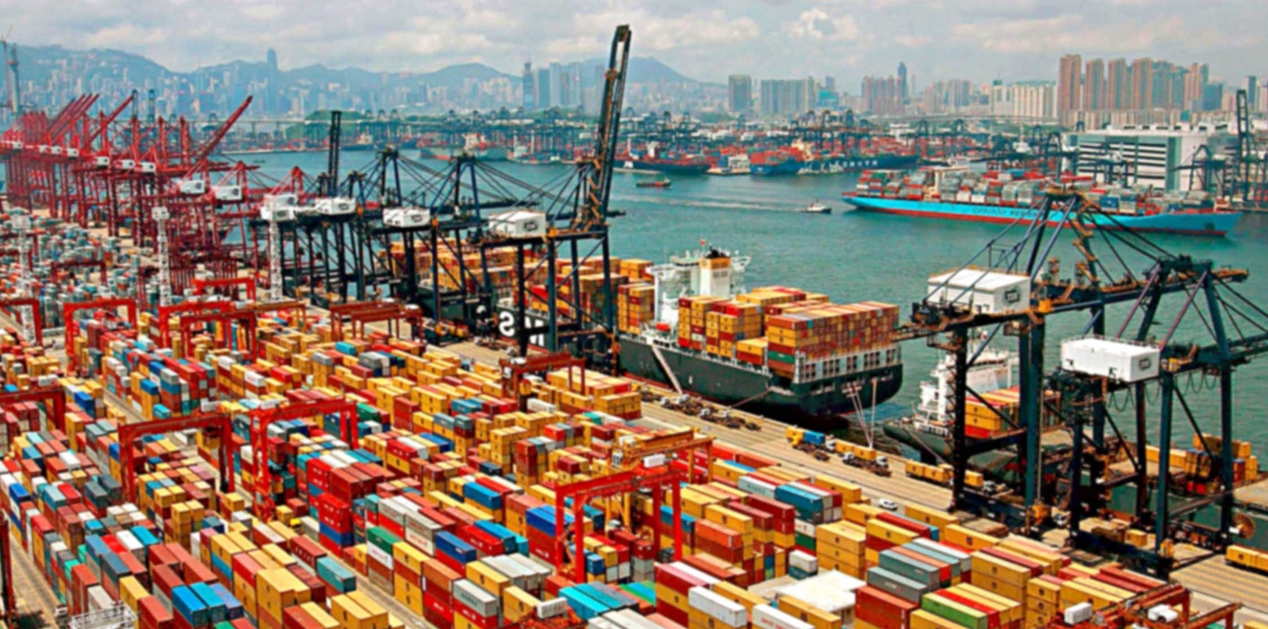
Published Date: 18th July 2016, Image Source: https://portalexport.wordpress.com
(Disclaimer: The views and opinions expressed in this article are those of the author and do not necessarily reflect the official policy or position of the Vivekananda International Foundation)
-

Indian foreign policy under the Modi government has been characte
-

The general elections for the National Majlis (Parliament) of Mal
-

India possibly can boast of having one of the largest (nearly 35
-

Following the visit of an Indian delegation to Afghanistan in Mar
-
The plenary sessions of the Chinese People’s Political Consulta
-

Background Chief of Army Staff (COAS) of the Indian Army, Gene
-

Premise This work attempts to analyse the following premise:-
-

Modi is the first and only Prime Minister to place before the peo
Post new comment