India’s economic growth for the financial year 2016 has been estimated at 7.6 per cent as compared with the revised estimate of 7.2 per cent in the previous year, aided mostly by growth in the manufacturing sector.
However, the GDP growth for the third quarter of this financial year slowed to a four-quarter low at 7.3 per cent. In the second quarter, it had grown by 7.7 per cent.
The optimism is at odd with weak exports, railway freight, cement production, investment and flat order books that pointed to weakness in the economy. In nominal terms, however, GDP would grow just 8.6 per cent in the current financial year, which would make the fiscal consolidation exercise of the government a great challenge.
Also the surprise is about the spurt in manufacturing both in the 3rd quarter as well as 2015-16 which is not reflected in the index of Industrial production –IIP which grew only 3.9 per cent in April –November—Somewhere something is amiss
More important is the increasing scepticism about GDP numbers. Even RBI Governor has voiced his concern and of course like a good bureaucrat-- later he retracted.
The important point is about the GDP numbers based on new base year of 2011-12 and its reliability. Also CSO has given up the earlier system of organised and unorganised sector. Instead they have household and Non-profit institutions serving households [NPISH] following G-7 style.
The major differences between old series with base year as 2004-05 and new series as 2011-12 are
1. GDP at factor cost is now passé and will not even be mentioned by the government in future statements. GDP at market prices was recorded in the past as well even though it was not counted while calculating economic growth.
In place of GDP at factor cost, gross value added (GVA) at basic prices will be used now.
The difference between GDP at factor cost and GVA at basic prices is that production taxes are included and production subsidies excluded from the latter.
Production taxes and subsidies are different from product taxes and subsidies.
These (production taxes) are imposed even if the products are not produced, such as property tax. However, excise duty, value added tax etc. are all product taxes. Similarly, product subsidies would not include interest subsidies, which will form part of production subsidies. Now, GDP at market prices would come by adding product taxes and deducting product subsidies from GVA at basic prices.
GVA at factor cost rose 4.9 per cent in 2012-13 and 6.6 per cent in 2013-14. The net result was that GDP at market prices rose 5.1 per cent in 2012-13 and 6.9 per cent in 2013-14.
Within GDP as well, composition of various sectors have changed. For instance, the share of manufacturing rose from 12.9 per cent in the old base to 18 per cent in the new series for 2013-14. The government wants to increase the share from 18 per cent to 25 per cent in a decade. This was because certain services that go into after product moves out of factory are included in the manufacturing.
Two kinds of approaches — establishment and enterprises — are used in calculating manufacturing production. Till now, only establishment approach was used which means calculating production plant by plant. On the other hand, in enterprises approach the activities at headquarters are taken into account. For instance, after an item is produced, various marketing and sales promotion efforts go at headquarters level. In accounting parlance it is looking at operating surplus [only from manufacturing] and surplus after taking into account head office expenses and sales and marketing expenses.
In the new GDP data, establishment approach is used for small companies as they have a few plants or sometimes a single plant. But, for large corporate, enterprises approach is used.
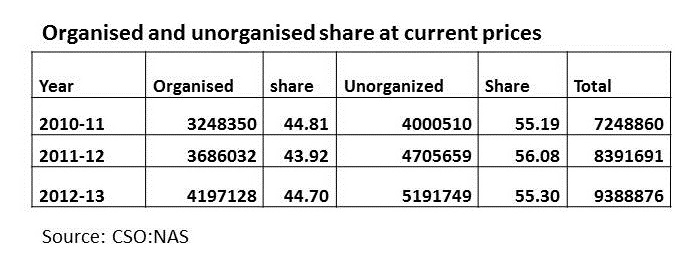
2. The category of organised and unorganised is discontinued. There is no statement 76.1—which contained the separate share of organised and unorganised sector in NAS 2015 as was the case in NAS 2014.
3. This is a major change and requires substantial explanation. In the earlier situation the share of unorganised sector was:
Most of Agriculture-95%; nearly 30% in manufacturing; 78 % in Trade/hotels and restaurants and 80% in Non-Railway transport.
All at 2012-13 Gross value added or GDP at factor cost at current prices.
Now Central Statistical organisation has “abolished” unorganised sector in their statistics not in real economy.
This “unorganised sector” is now included in Household sector and NPISH (Non-Profit institutions serving households).
More fascinating is the inclusion of unincorporated enterprises –maintaining accounts is included under private non-financial corporate sector.
How unincorporated can be part of Corporate is CSO mystery .More than that “unorganised Financial enterprises” is also included under private financial corporations.[ p7; changes in Methodology and Data sources in The New series of National accounts –Base year 2011-12 –CSO;MOSPI]
Does it imply money lenders near my market are included as part of private corporate?
Due to all these---Estimates of GVA at current prices 2011-12 [at factor cost for old series and base prices for new series] varies significantly [of course a caveat is given that they are not strictly comparable]
In manufacturing it shows a 20% positive difference from RS 12 lakh crore to Rs 15 lakh crore; in trade/hotels and restaurants a reduction of 40% from Rs 15 Lakh to Rs 9 lakh crore and in other services a reduction of 20 % from Rs. 7 lakhs to Rs 5 lakhs crore.
Statement 9 in the press release of Ministry of Statistics and Programme Implementation (MoSPI), dated 30.1.2015 or Statement 1.14 in NAS 2015 (both are available on the website of MoSPI) presents institutional sector-wise GVA in the economy. From this statement it is possible to work out share of organized and unorganized sector with limitation that estimates of quasi-corporates not being available separately in the new series for 2011-12 to 2013-14. The share of unorganised sector which is household and NPISHs in 2011-12 series for the year 2011-12 at current price is 44.9%. The share of unorganised which included household and unorganised enterprises for the year 2011-12 in 2004-05 series was 56.1%.This difference is due to inclusion of quasi corporates in the corporate sector and also due to use of latest data from NSS 67th round on unincorporated sector.
In short massive amount of unorganised is shifted as “corporate” under quasi corporate definition.
This whole idea of quasi-corporate is not clear since an enterprise is corporate –under the corporate laws or partnership/proprietorship under 1932 partnership act or under income tax Act. Quasi-corporates are like partly pregnant.
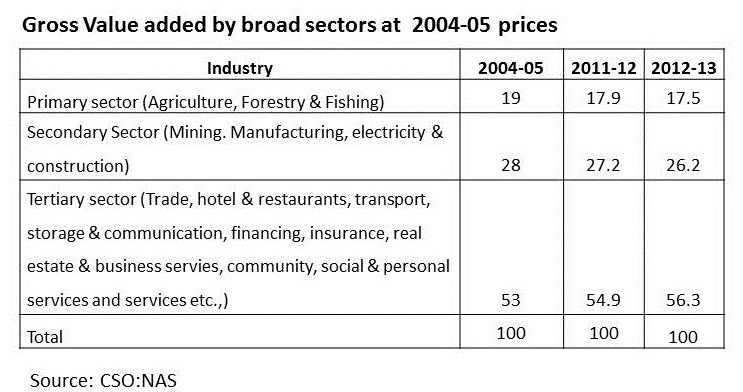
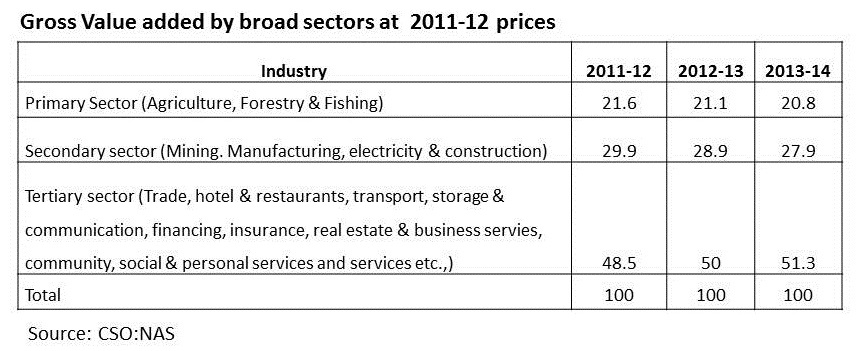
We have given below in tables the relevant comparisons.
From table-2 we can infer that suddenly the role of households have come down mostly from tertiary sector where household only have 36% share compared to “corporates” who have 64 %. Earlier “unorganised” sector—which is the proxy for the present household sector-- had nearly 70 to75% share in Tertiary sectors

Looking at table 3 and 4 we find that share of tertiary sector has come down and that of manufacturing has gone up—due to statistical changes only.
More importantly the changes are due to extensive usage of Ministry of Corporate affair data on corporate and other quasi corporate using estimates.
Within Manufacturing itself if we compare the GVA of organised manufacturing[excluding quasi corporations of the unincorporated enterprises] of new series with GVA of registered manufacturing of old series for 2011-12 we find it was Rs 94 lakhs crore which has increased due to changes in mechanics to Rs 127 lakhs crore –an increase of 35% [ see table 20 in page 47 of changes in Methodology and Data sources in The New series of National accounts –Base year 2011-12 –CSO;MOSPI]
We find it difficult to understand that GVA of registered [namely organised] manufacturing for the year 2011/12 at factor cost for 2004/05 series and at basic prices for 2011/12 series can make a difference of 35% even if all changes are accommodated unless the role of corporate are very large in later series.
In the case of unorganised manufacturing the situation is reverse with the GVA coming down from Rs 35 lakhcrore to Rs 28 lakhcrore a fall of nearly 20%
This whole things makes it appear that our economy is suddenly more corporate than before –which it is not.
The Gross value added by household sector for the year 2011-12at factor cost for old series and basic prices for new series has fallen from Rs 47 lakh crore to Rs 37 lakh crore a fall of more than 21%.
The fall is severe in manufacturing at 49%; trade 59%; hotels and restaurant 42%; non-Railway transport 45% and other services by 54%
One reason given is the usage of company data more extensively in the new series compared to old series. Nearly 5 .25 Lakhs companies are used now. Whether it is pro-rate boosting of GVA-- based on share capital or detailed analysis is not clear. The GVA of non-financial private corporate sector in 2011-12 series compared to using earlier series at 2004-05 has increased by 9.8%; most of the increase has come about in manufacturing 29%; non-Railway transport 70%. Interestingly in trade it has come down by 63% which is puzzling unless we assume quasi corporations have played large role to boost it.
Conclusion:
We cannot say with confidence that the GDP estimate of 7.6 per cent suggested is reliable in the absence of details regarding converting “unorganized sector” into “organized” and creating a “quasi organized”. Inclusion of unincorporated as corporate is puzzling more so inclusion of “unorganized financial enterprises” as belonging to Quasi corporations and hence “corporate sector”. Hence the growth rate could be much higher or lower and our “guesstimate” is it is lower towards 7 per cent.
The methodology adopted by CSO in using the details of companies numbering more than 5 lakhs needs to be explicitly stated. Most of the companies are shell or dummy companies.
CSO should bring out a USER FRIENDLY—“Sources and Methods “guidebook. But readability and simplicity should be the norm. The earlier versions are simply not user friendly and more confusing. In this CSO can look at and imitate US statistical service.
Many other economists Like R.Nagaraj of Indira Gandhi Institute of Development Research –Mumbai]; C.R John Member Planning Board –Kerala;Surjit Bhalla [Delhi based Economist] etc. have also raised concerns about Corporate inclusion and need to share raw data sources.
We have produced world renowned statisticians like Mahalonobis/CR Rao/R C Bose etc. but our data base and explanations do not justify these experts.
The Ministry of statistics and Programme Implementation is considered as “punishment” posting for ministers and allotted to those who are neither knowledgeable about statistics nor understand the need for good data base.
It is required that Government constitute a commission –independent of the current “experts” involved—to look into this whole issue of drastic revision and need for transparency.
In appointing such a commission Government need to recognize that all experts in economics/Statistics are not available only in Delhi and all those in Delhi are not necessarily experts.
References:
- Anindita Sinharay, Ashish Kumar & T C A Anant: Decoding the GVA growth rate -http://www.business-standard.com/article/opinion/anindita-sinharay-ashish-kumar-t-c-a-anant-decoding-the-gva-growth-rate-115072801461_1.html
- Why 7.6% growth is hard to square - http://www.thehindu.com/opinion/lead/why-76-growth-is-hard-to-square/article8224204.ece [ Prof R Nagaraj of IGDIR]
- Let People Know Methods of GDP Growth Calculation - http://www.newindianexpress.com/magazine/voices/Let-People-Know-Methods-of-GDP-Growth-Calculation/2016/02/20/article3284525.ece [ C.P John Member _Kerala state Planning Board]
- India’s GDP growth seen accelerating to 7.6% in FY16 - http://www.livemint.com/Politics/nlmtj4uHBrrsf9IDGCCbsN/Indias-GDP-grows-at-73-in-December-quarter.html [ Asit Rajan Mishra ]
- No Proof Required: Believe it, GDP data is right - http://indianexpress.com/article/opinion/columns/no-proof-required-believe-it-gdp-data-is-right/#sthash.xMExDMY5.dpuf [Surjit Bhalla]
Published Date: 27th February 2016, Image Source: http://www.thehindubusinessline.com
(Disclaimer: The views and opinions expressed in this article are those of the author and do not necessarily reflect the official policy or position of the Vivekananda International Foundation)
-

Following the visit of an Indian delegation to Afghanistan in Mar
-
The plenary sessions of the Chinese People’s Political Consulta
-

Background Chief of Army Staff (COAS) of the Indian Army, Gene
-

Premise This work attempts to analyse the following premise:-
-

Modi is the first and only Prime Minister to place before the peo
-

From being an intensely hated person, he has become the most admi
-

The Jallianwala Bagh massacre on April 13, 1919, in Amritsar, Pun
-

While more than sixty countries around the world will conduct dem
Post new comment